


You walk into your weekly marketing review feeling pretty good. Your LinkedIn campaign hit all its targets this month. CTR is up 15%. CPL is down 12%. Impressions are through the roof.
Then someone from sales pipes up: "Cool numbers, but where are the qualified opportunities? We got 200 leads last month and closed one deal."
Welcome to the vanity metrics trap.
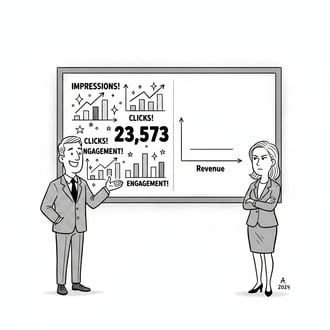
Impressions, clicks, and cheap leads feel good in the moment, but they don't drive revenue. Misaligned incentives mean your campaign "wins" don't translate to pipeline. And the painful realization hits: you hit all your targets, but sales says the leads are terrible.
The business doesn't care about your CTR. They care about pipeline generated, opportunities created, revenue influenced, CAC relative to LTV, and payback period. That's it.
Strong B2B programs convert 50-60% of MQLs to SQLs and generate 30-50% of the sales pipeline from marketing (Martal Group). The key bottleneck? MQL to SQL conversion, which averages just 15-21%. If you're optimizing for clicks or cheap CPL, you're optimizing for volume at the expense of quality. Sales will hate you for it.
Examples of Misalignment vs Alignment
Misaligned:
- Optimizing for clicks → High CTR, low conversion quality
- Optimizing for cheap CPL → Volume of junk leads
- Optimizing for MQLs → Sales complains about quality
Aligned:
- Optimizing for pipeline dollars → Fewer but better leads
- Optimizing for SQL conversion rate → Focus on ICP fit
- Optimizing for CAC:LTV ratio → Long-term sustainability
Mapping Platform Metrics to Business Outcomes
Not all metrics are created equal. Platform metrics are inputs. Business outcomes are what matter.
CTR tells you about message resonance with your audience. CPL tells you about cost efficiency, but it's not a quality signal. Form completions show potential lead volume.
What actually matters: MQL→SQL conversion signals audience and message fit. SQL→Opp conversion shows sales-ready quality. Opportunity value indicates real pipeline contribution.
The 3-5 Core Metrics for 2026
Stop tracking 47 different metrics in your dashboard. Focus on these:
- Blended CAC (across all channels) - Is cost sustainable?
- MQL→SQL conversion rate - Are we targeting the right people?
- Pipeline contribution - How much revenue are we influencing?
- CAC payback period - How fast do we recover investment?
- ROAS (where attribution allows) - Overall efficiency check
Set guardrails around each: CAC can't exceed X% of LTV. Payback period must be under Y months. MQL→SQL must stay above Z%.
At Yirla, we connect platform metrics to pipeline outcomes so you're not left guessing whether your LinkedIn spend is actually driving revenue. We show CAC, LTV, and payback all in one place instead of scattered across five different tools. And we focus you on what drives revenue, not vanity metrics that make your boss feel good in the moment but don't move the business forward.
The gap between marketing teams that get budget increases and those that get cut? It's not creative talent or channel expertise. It's whether they can prove they're driving pipeline, not just activity.
This level of rigor requires treating campaigns as learning machines, not one-and-done projects.
